All About Your Ancestry Report
When your saliva kit reaches our lab, we extract DNA and use state-of-the-art sequencing machines to read the complete genetic sequence of almost all genes and a carefully selected set of additional sites across the genome. We then compare this genetic data to reference groups of individuals from around the world to calculate how similar you are to those groups. You will receive email from us when your ancestry report is ready.
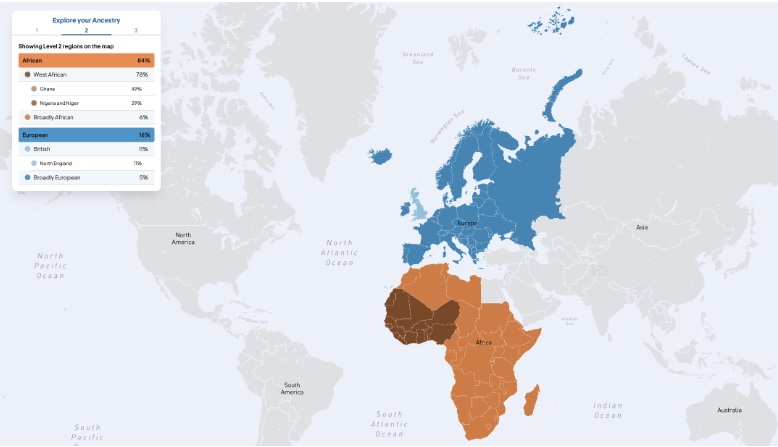
The result is an ancestry report such as this one that shows percentages of how similar you are to each group.
There are three levels of results.
- Level 1 shows percentages corresponding to continental regions (African, Americas, South and Central Asian, East and South East Asian, European and Middle Eastern).
- Level 2 splits the percentages into a larger set of smaller regions.
- Level 3 is the finest level of resolution. When percentages are small, they are rolled into broader regions. For example, you may see results reported as “Broadly European,” “Broadly African,” etc.
When viewing your report, you will see a table of percentages and an interactive map. Clicking a row in the table will zoom into that region on the map.
Ancestry estimation depends on two components. The first is the reference panel, which consists of the genetic data of individuals of known ancestry. The second is the algorithm, the computational approach that takes a participant’s genotypes and matches that against the reference panel, looking for which ancestral groups are closest to the participant along each stretch of the genome. Because of these two components, ancestry estimates are estimates, not certainty, and may vary depending on the reference panel and the algorithm.
We use a threshold of 10% for reporting a specific ancestry region, so, for example, if our estimate was that you were 9% Swiss we would not report that other than including it in the larger regional category of Broadly European, while if the estimate were 10% or higher, we would report Swiss.
Genetic ancestry turns out to be a bit slippery once you start considering it. My grandparents were all born in either Wisconsin or New York State, but most people would not say that I have Northeast-Midwest ancestry. Yet, if they had been born in England and Poland, people would probably say I had English-Polish ancestry. How far back in time one goes is another complication—some of my ancestors lived in Russia, but their children moved to Poland long ago, and their descendents moved to Wisconsin in the late nineteenth century. Is that part of my ancestry Russian, or Polish, or Wisconsin? Geneticists typically have to be satisfied by trying to have lots of people who, for example, say that they are Polish, rather than trying to incorporate their family genealogy, although some reference panels are able to use people with, say, all four grandparents from the same region. Because people sometimes move around quite a bit, there can also be adjoining regions that are difficult to distinguish, such as French and Italian.
Ideally, we would have an enormous reference panel with multiple people from every region of the world. Unfortunately, our panel falls short of that ideal—many existing panels have usage restrictions that prevent us from taking advantage of them. Nonetheless, we are actively working to expand our panel. If you have ancestry from a region that is not represented on our panel, what will happen is that the algorithm will generally match those portions of DNA to the genetically closest group.
We plan to expand our panel and update our algorithm about once a year, so you may see a new estimate roughly a year from now. We’ll let you know when it is available. If you are interested, there’s an informative webpage about how ancestry estimation works at https://www.nist.gov/how-do-you-measure-it/how-do-companies-measure-dna-discover-your-ancestry .